

01Calendar
See consistency across the month.
Read green and red days in context, compare weekly totals, and spot whether one session is carrying the entire month.
Separate a repeatable month from one lucky day.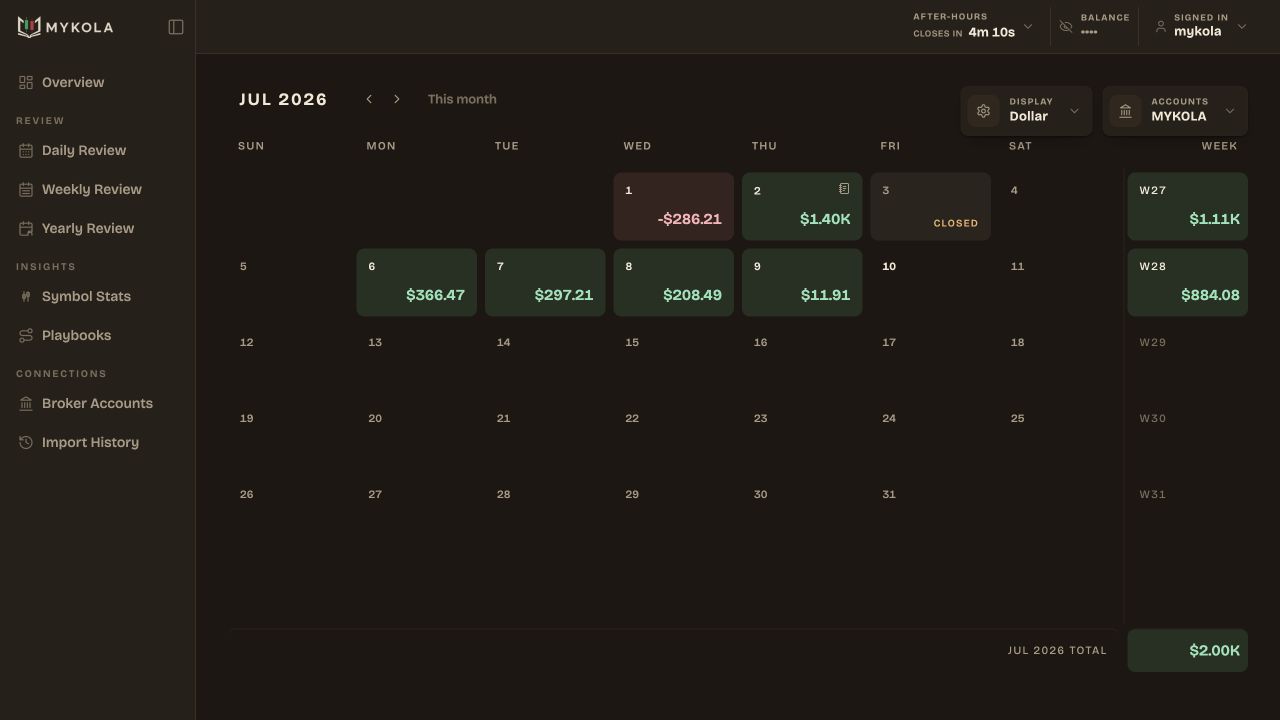
Mykola connects your actual executions to the questions that determine consistency: which setups hold up, where risk breaks down, and what to practice next.
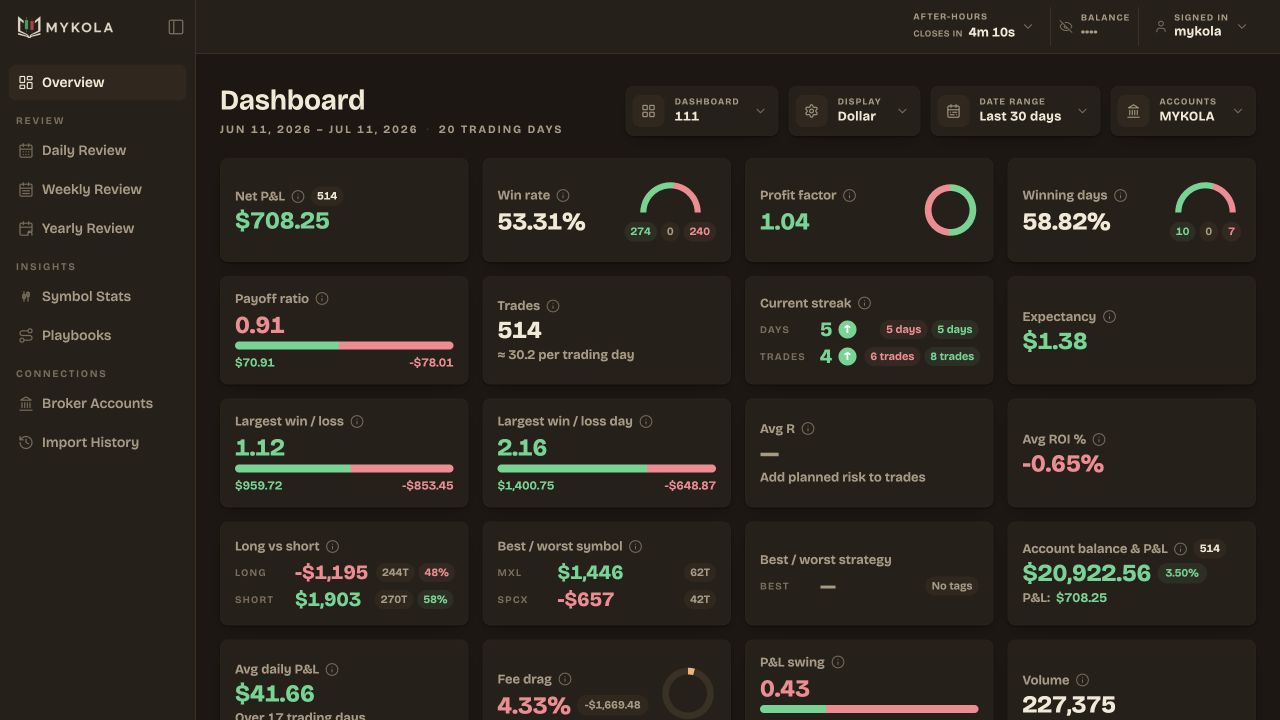
These are live application screens captured from Mykola—not mockups, illustrations, or reconstructed widgets.
Read green and red days in context, compare weekly totals, and spot whether one session is carrying the entire month.
Separate a repeatable month from one lucky day.Open any trading day, inspect its intraday curve and execution statistics, then attach the note that explains the decisions behind the result.
Correct behavior instead of reacting to P&L.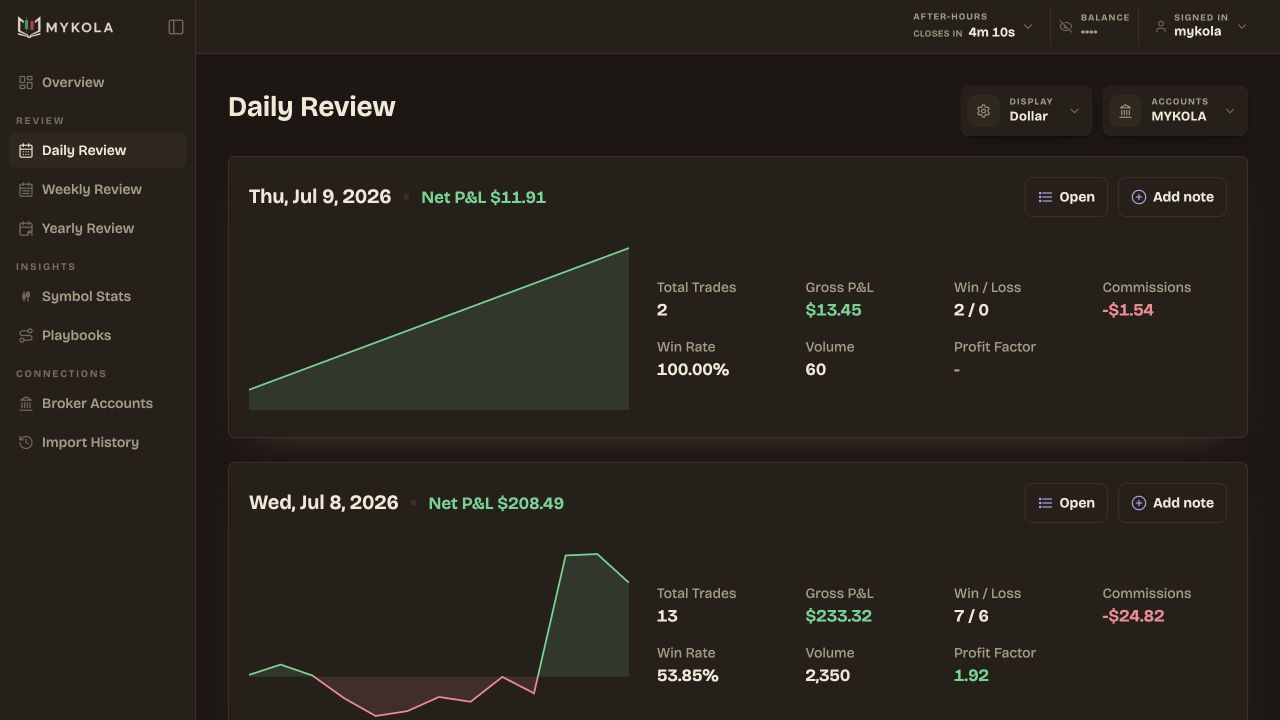
Compare each session inside the week and see the range, trade count, win rate, profit factor, volume, and commissions together.
Carry one measurable focus into the next week.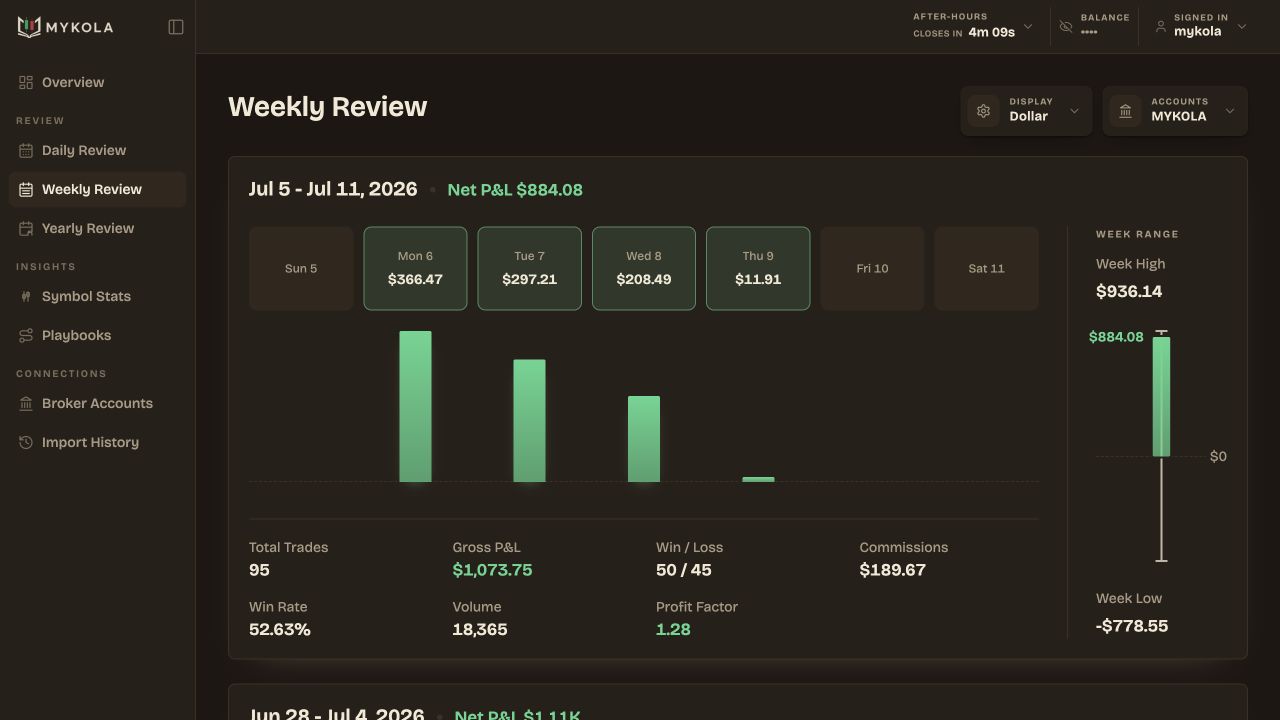
Scan the complete year by quarter and month to reveal concentration, drawdown periods, active-day coverage, and changes in win rate.
Judge the process over a meaningful sample.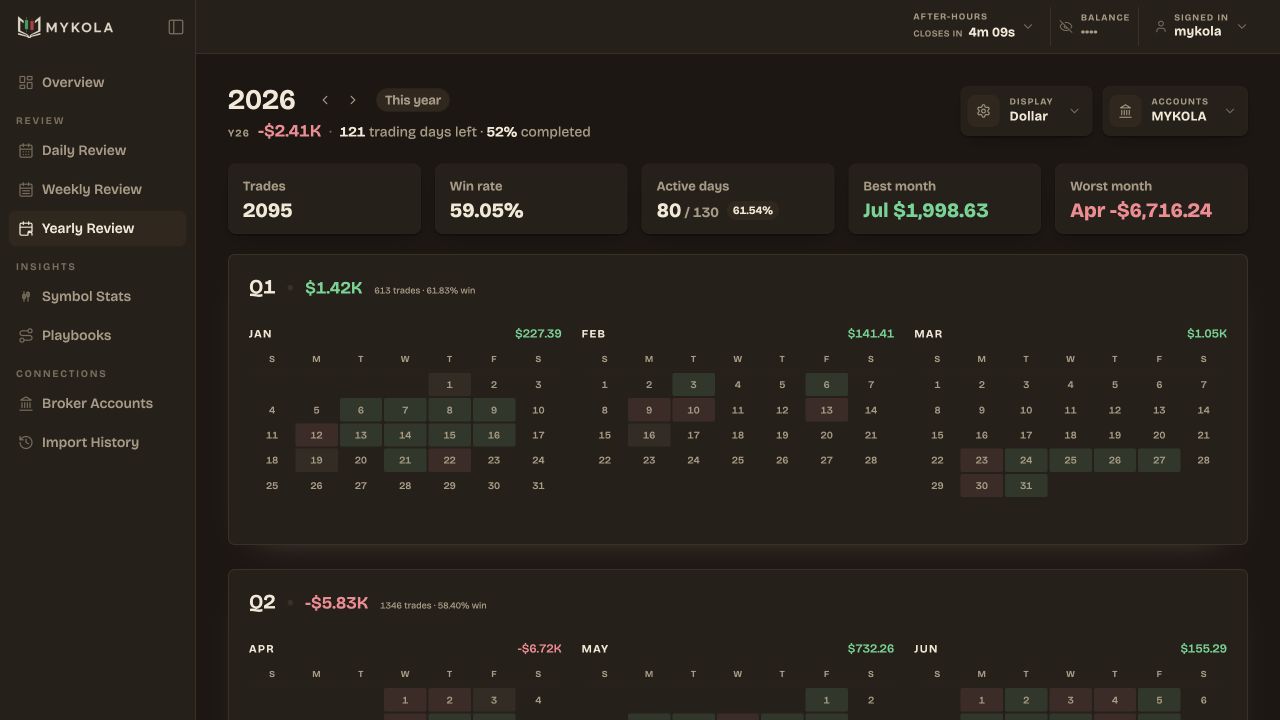
Rank every symbol by contribution, win rate, trade count, average return, and holding time without disconnecting the statistic from its sample size.
Focus on the names where your edge holds up.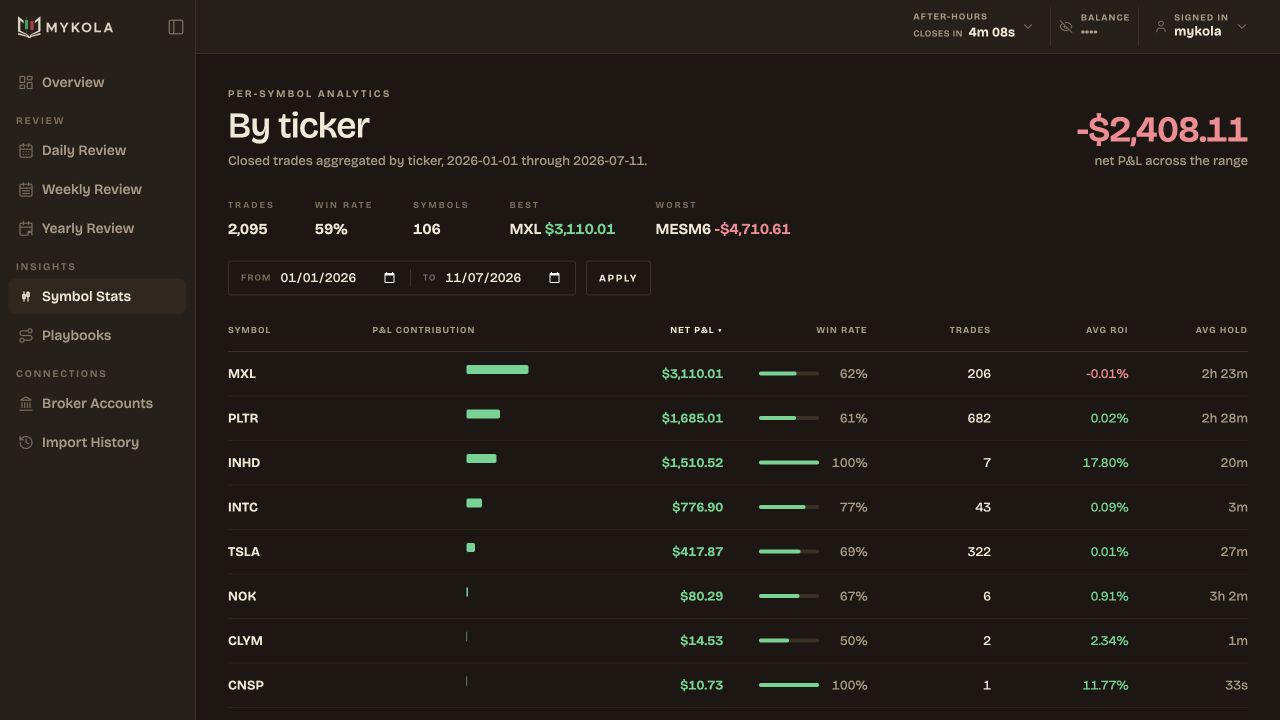
Tag trades with the setup you actually traded. Mykola turns those notes into comparable playbooks as your evidence accumulates.
Measure the setup, not the story you tell about it.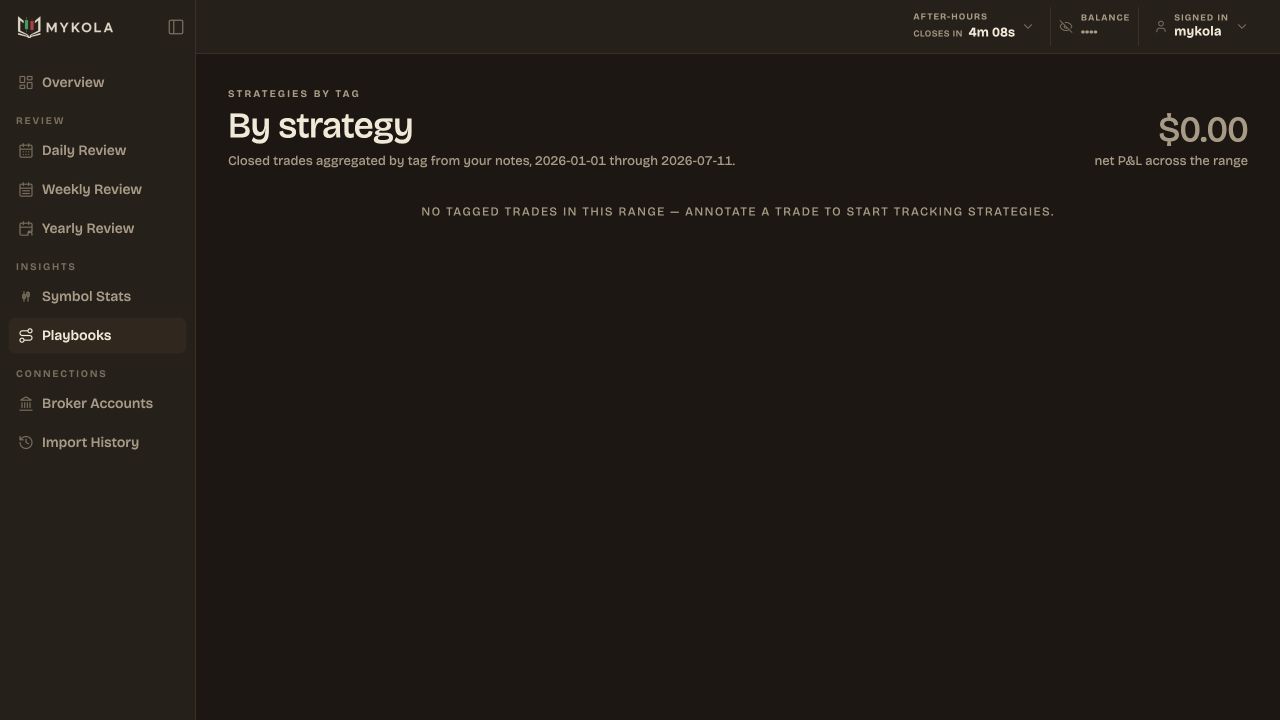
Connect supported brokers, control syncing, manage balances, and keep disabled accounts available without contaminating current analysis.
Review the complete record across accounts.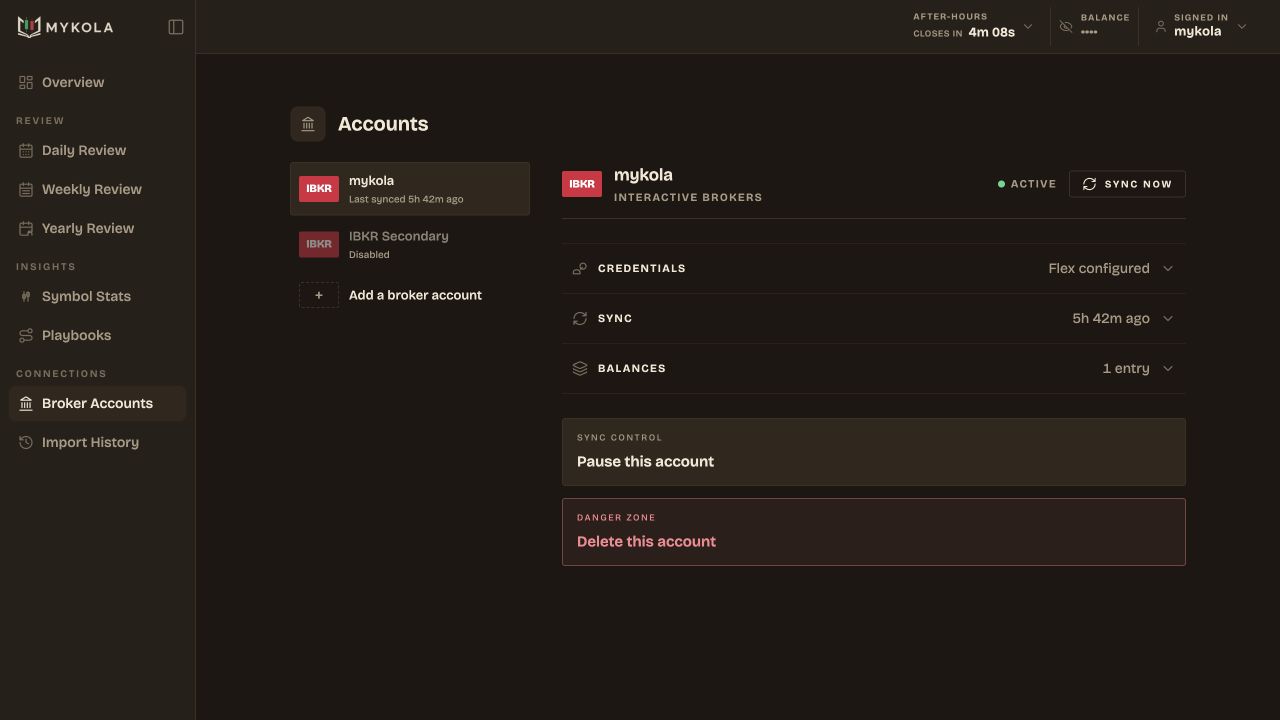
Audit every broker fetch, source, account, timestamp, and imported row count so missing data never stays invisible.
Trust the evidence before acting on it.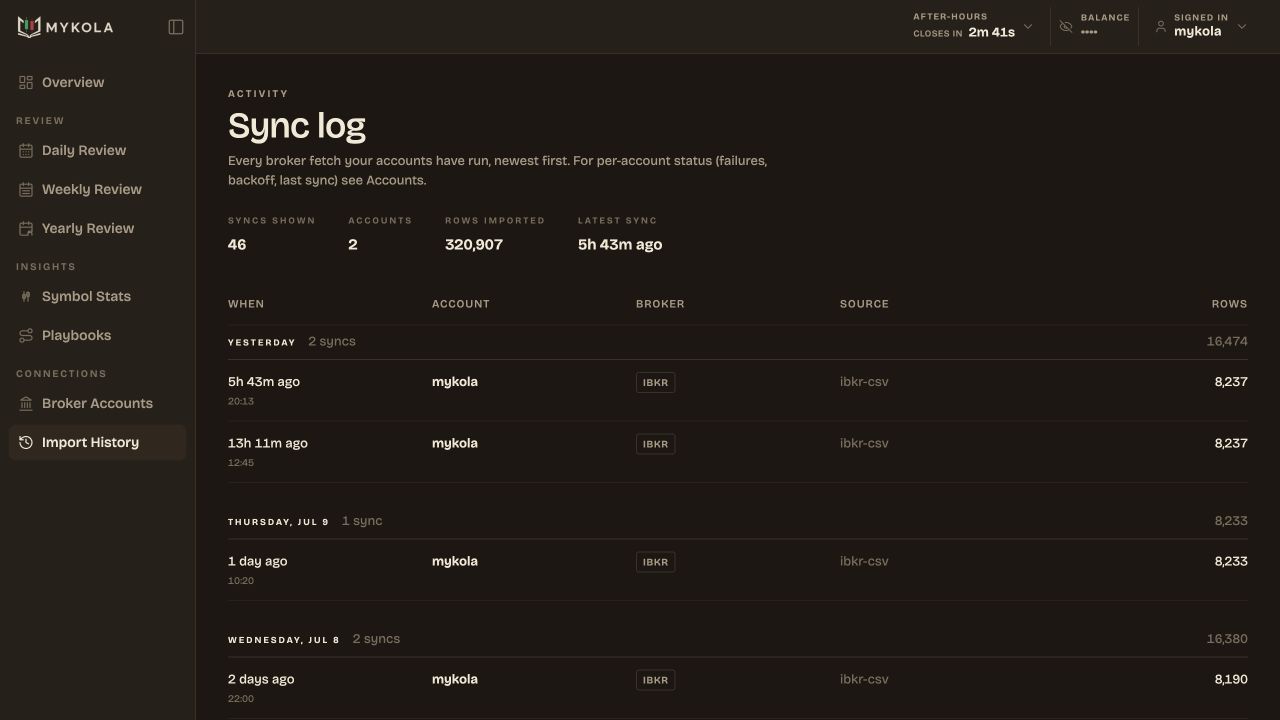
Detailed product references, organized around the questions traders ask.
See the KPIs, charts, calendars, risk views, and review tools available in Mykola.
Browse dashboard widgetsRead plain-language definitions and worked examples for the statistics behind your review.
Open the stat glossaryCheck supported brokers, connection methods, and file-import options before you begin.
Browse supported brokers